
Ozone (O3)
Ozone (O3) plays a major role in the chemical and thermal balance of the atmosphere. In the stratosphere, the ozone layer has a beneficial role as it absorbs harmful ultraviolet radiation. In the troposphere, O3 plays different roles depending on altitude. Near the surface, ozone in excessive amounts is one of the main air pollutants impacting both human health and ecosystems. In the upper troposphere, ozone is an important anthropogenic greenhouse gas and acts as a short-lived climate forcer. Tropospheric O3 originates either from complex photochemical reactions involving nitrogen oxides (NOx), carbon monoxide (CO) and hydrocarbons or from the stratosphere by downward transport to the troposphere especially at mid- and high- latitudes as well as from long-range transport. The lifetime of tropospheric ozone varies with altitude and ranges from 1 to 2 days in the boundary layer, where dry deposition is the major sink, to several weeks in the free troposphere, meaning that the transport scale of O3 can be intercontinental and hemispheric. Therefore, to better understand its variability and impacts, it is crucial to obtain information on its vertical, spatial and temporal distribution. This information can be provided by observations from spaceborne instruments.
The IASI O3 Level 2 products are retrieved in a near real time mode using the Fast Optimal Retrievals on Layers for IASI O3 (FORLI-O3) software (Hurtmans et al., 2012), which was developed by ULB in collaboration with LATMOS. These data are part of the European Space Agency O3 Climate Change Initiative (Ozone_cci) and the European Centre for Medium-Range Weather Forecasts (ECMWF) Copernicus Climate Change (C3S) projects, respectively. These programs focus on building consolidated climate-relevant ozone datasets as essential climate variables (ECVs). The IASI O3 products retrieved using FORLI-O3 will be the official IASI/Eumetsat O3 product in 2019.
The IASI daily O3 products are distributed via the AERIS data center and are available at: https://iasi.aeris-data.fr/O3/.
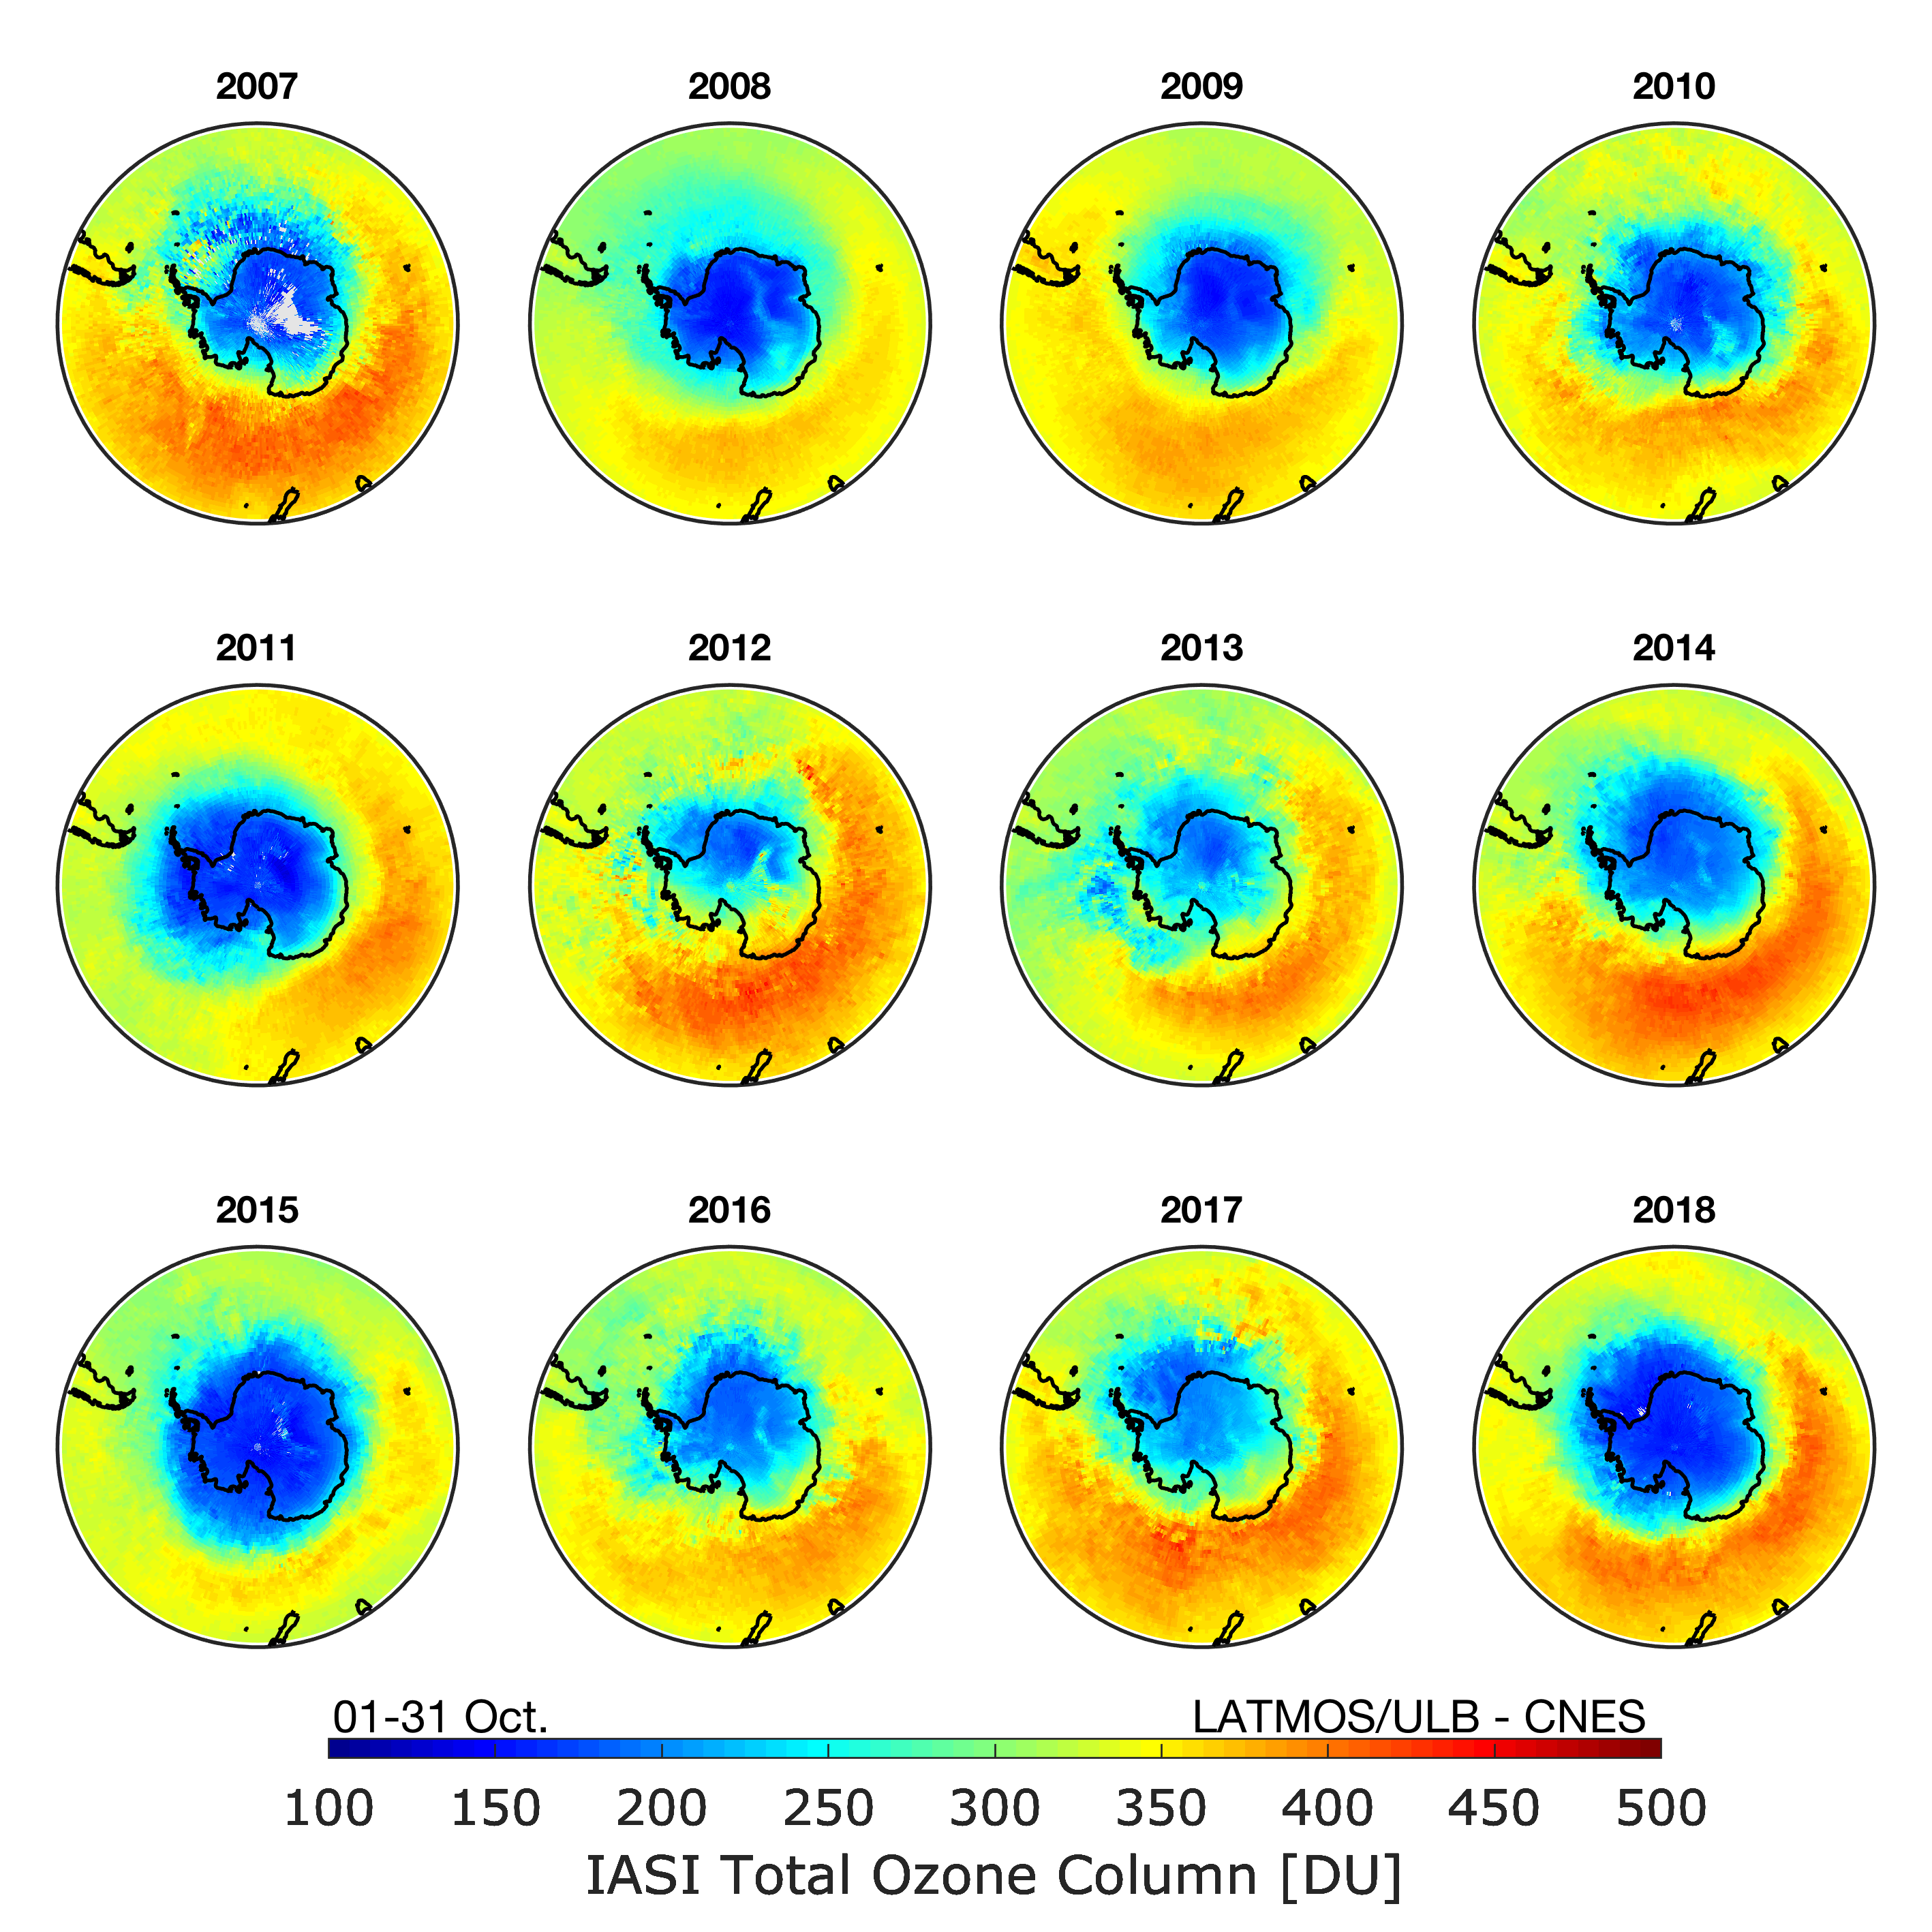
Figure 1. Monthly ozone total columns (in Dobson units) retrieved from IASI/MetopA+B observations
in October between 2007 and 2018. Extent and spatial distribution of the ozone hole vary
as a function of meteorological conditions (Courtesy Anne Boynard).
